Welcome to the
Survey of Doctorate Recipients
(SDR) site!
You can now view results from the 2023 SDR at https://ncses.nsf.gov/surveys/doctorate-recipients/2023.
We appreciate your interest in the survey and look forward to your participation in the next SDR.
The SDR is sponsored by the National Center for Science and Engineering Statistics within the U.S. National Science Foundation and the National Institutes of Health.
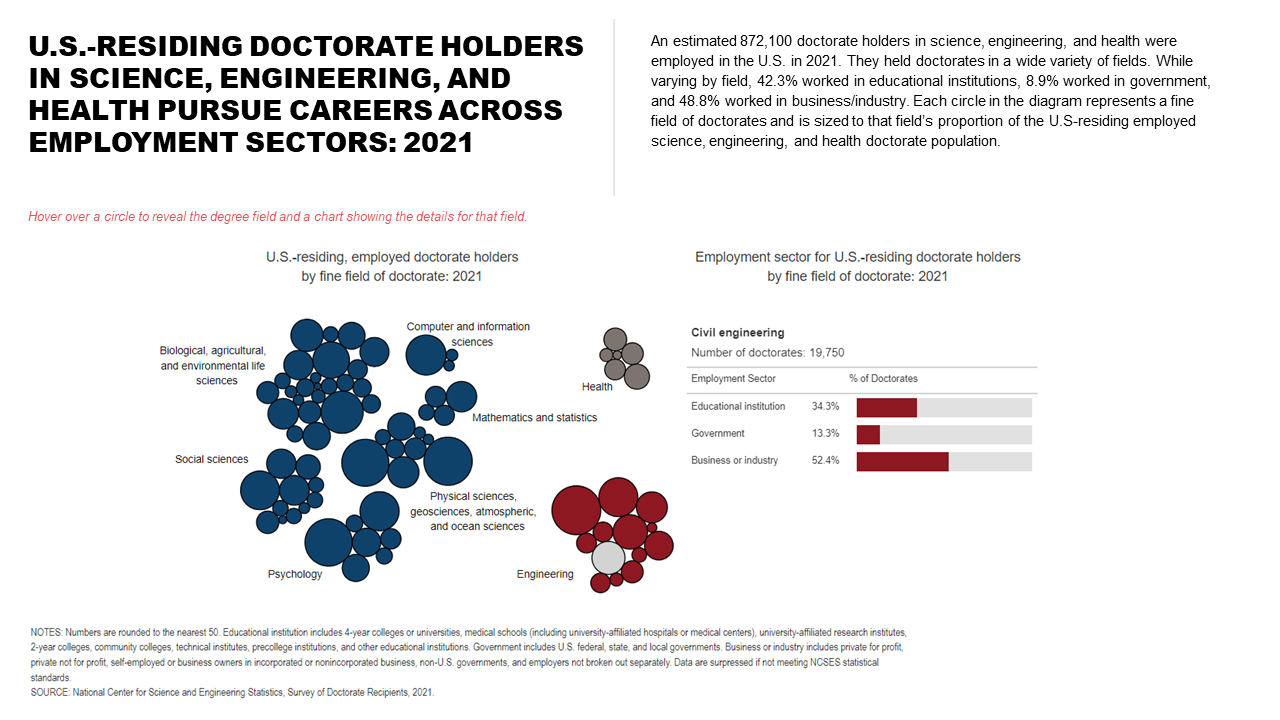
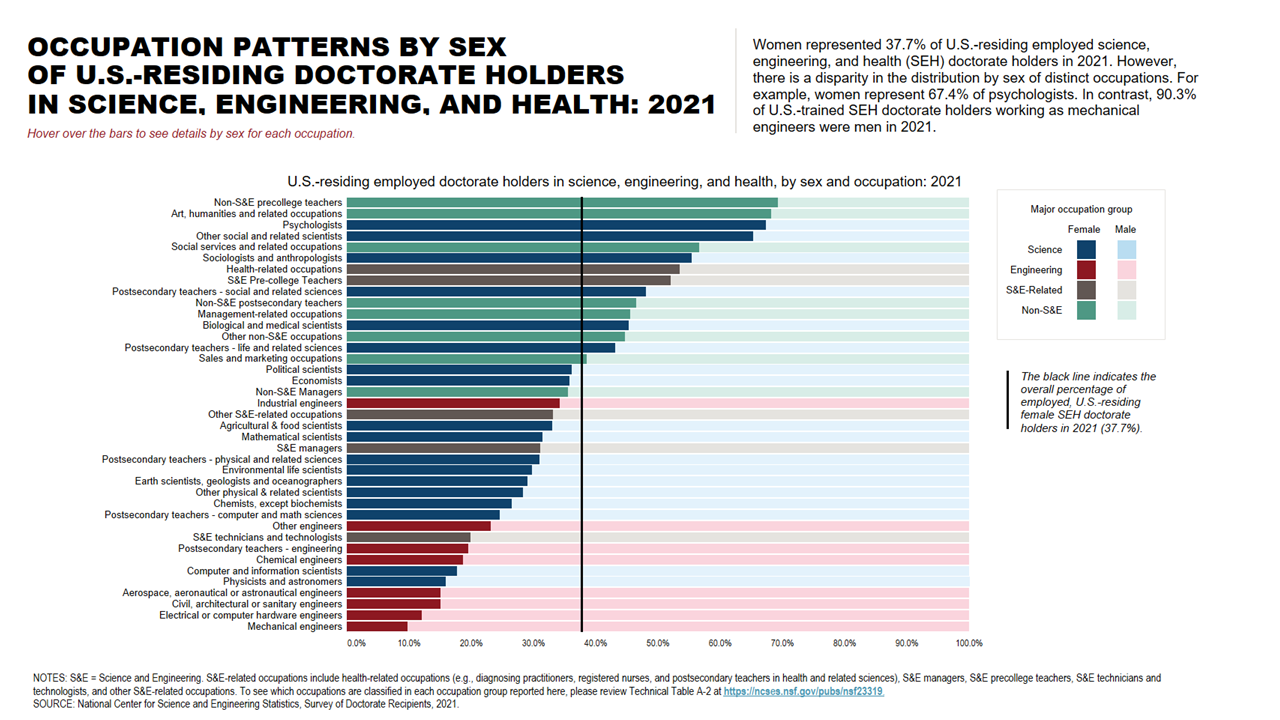
The Survey of Doctorate Recipients (SDR) is a survey of individuals who received a doctoral degree in science, engineering, or health (SEH) from a U.S. institution. The SDR represents doctorate degree holders who are working, retired, seeking work, or in some other situation. This study provides the only data on the education and training, work experiences, and career development of the U.S. trained doctoral population. The SDR is a unique source of information about U.S.-trained doctoral scientists and engineers living in the United States and abroad.
SDR DATA IN ACTION
Scroll to preview the data graphics. Click to expand and interact with the data.
Trouble seeing a graphic? If the expanded graphic is too large or small,
zoom to adjust the graphic image size.
The interactive graphics are best viewed on large screen devices (i.e., desktop).